3QFY2019 Result Update | Automobile
February 19, 2019
Ashok Leyland Ltd.
BUY
CMP
`79
Performance Update
Target Price
`122
(` cr)
3QFY19
3QFY18
% yoy 2QFY19
% qoq
Investment Period
12 months
Revenue
6,325
7,191
(12.0)
7,621
(17.0)
Stock Info
EBITDA
643
569
13.0
810
(20.6)
Sector
Automobile
OPM (%)
10.2
7.9
225bp
10.6
(47bp)
Market Cap (` cr)
31,219
Reported PAT
381
485
(21.5)
528
(27.8)
Net Debt (` cr)
3,739
Source: Company, Angel Research
Beta
1.1
For 3QFY2019, Ashok Leyland Ltd (ALL) posted results, which disappointed on
52 Week High / Low
168/78
both top-line as well as bottom-line fronts. Revenue de-grew by 12% yoy to
Avg. Daily Volume
18,63,726
Face Value (`)
5
`6,325cr. However, operating margin improved by 225bps. On the bottom-line
BSE Sensex
35,498
front, ALL reported PAT de-growth of 21.5% yoy to `381cr on the back of lower
Nifty
10,641
sales.
Reuters Code
ASOK.BO
Subdued top-line performance: The company’s top-line grew by 12% yoy to
Bloomberg Code
AL.IN
`6,325cr mainly due to 6.1% volume decline and 6.3% decline in average
realizations. Despite the strong pick-up in construction, infra-spending and
Shareholding Pattern (%)
mining activities in the country, management expects MHCV volumes to remain
Promoters
51.1
subdued in the next 2-3 quarters. Going forward, FY2020 is expected to be a
MF / Banks / Indian
9.1
FII / NRIs / OCBs
23.7
growth year due to pre-buying before BSVI implementation in India.
Indian Public/Others
16.1
PAT declined despite operating margin improvement: On the operating front, the
company’s margins rose by 225bps yoy to 10.2% due lower other expanses
Abs.(%)
3m
1yr
3yr
(down 397bp yoy). However, PAT de-grew ~22% yoy to `381cr on the back of
Sensex
1.6
4.4
52.0
lower sales.
ALL
(24.7)
(41.7)
(10.6)
Outlook and Valuation: We expect Ashok Leyland to register net profit (reported)
CAGR of ~10% to ~`1,884cr over FY2018-20E mainly due to improvement in
pre-buying sales (owing to introduction of BSVI norms in FY2020) and
replacement demand (implementation of vehicle scrappage policy). Thus, we
recommend BUY on the stock with Target Price of `122.
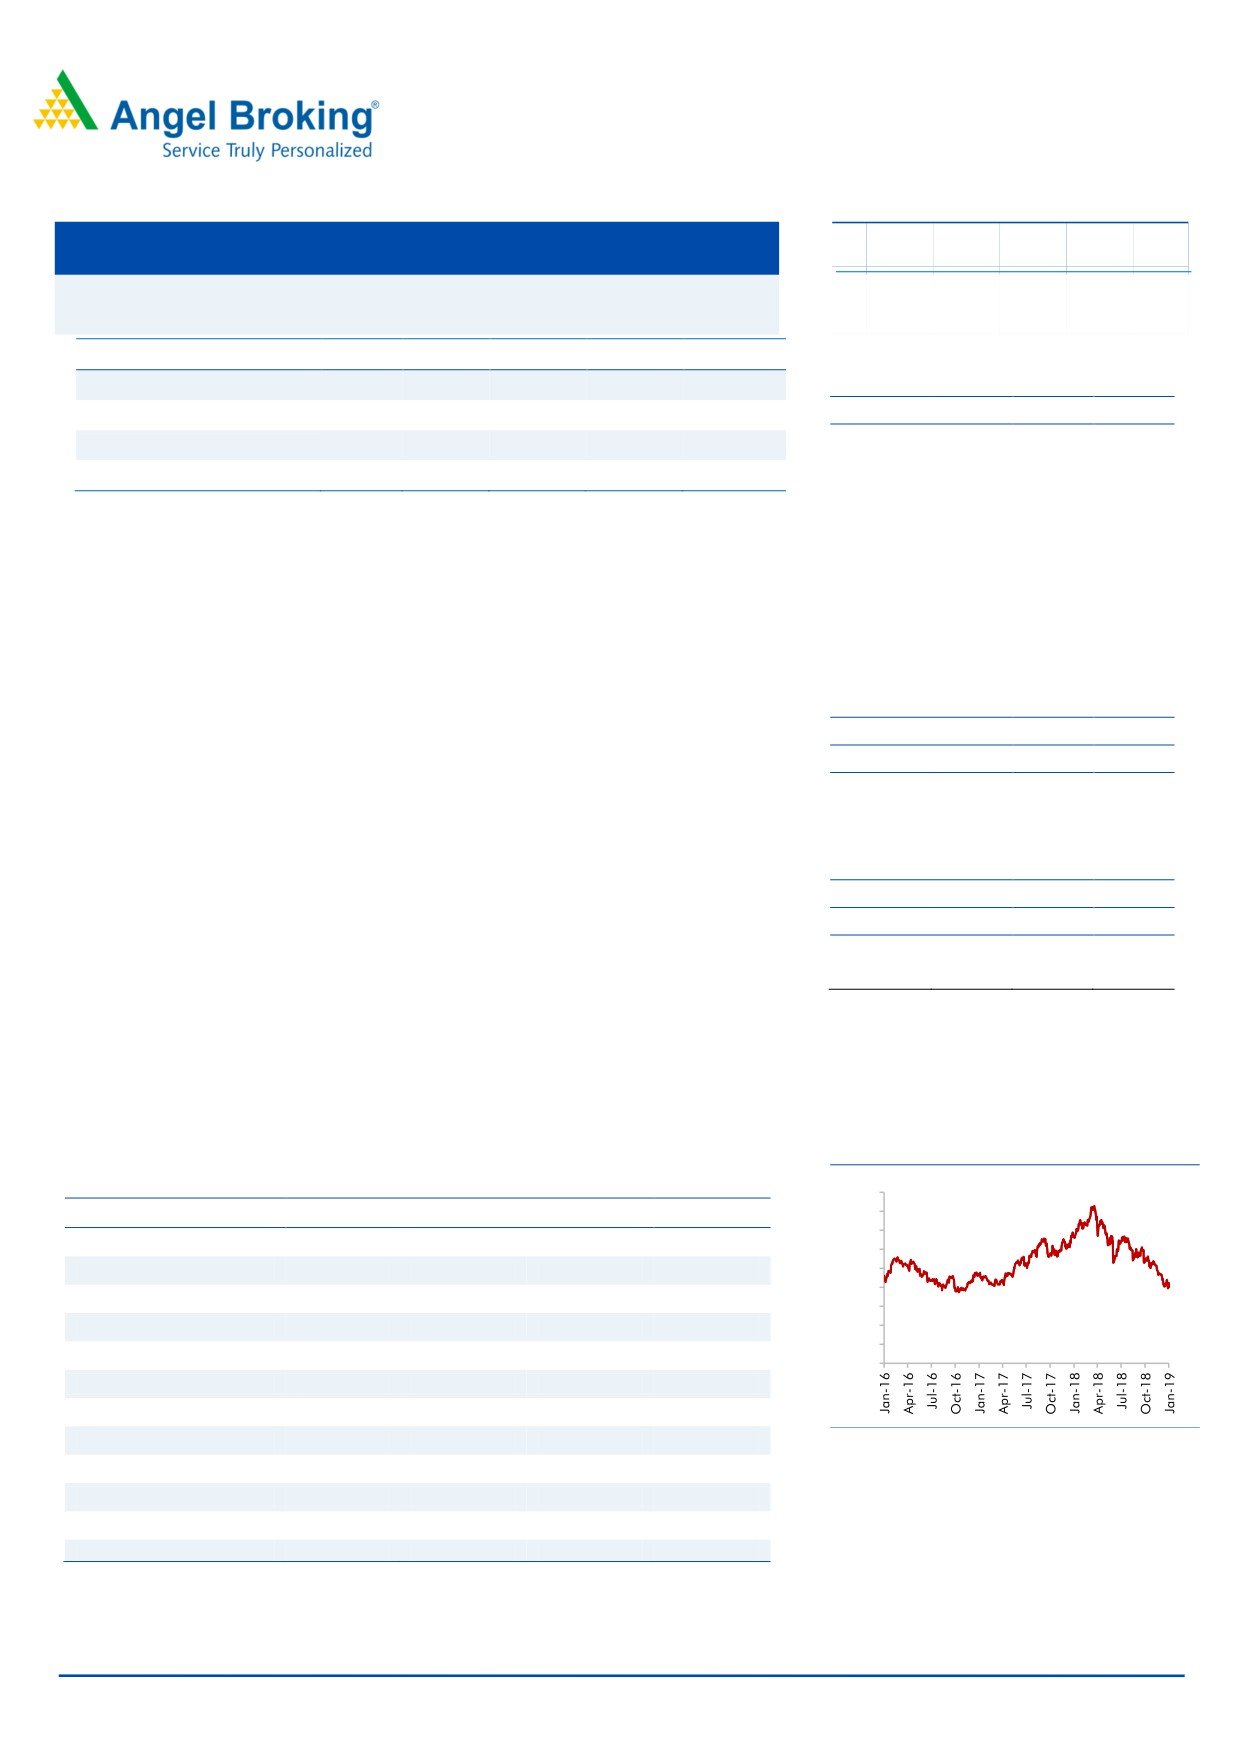
Historical share price chart
Key Financials
180
Y/E March (` cr)
FY2017
FY2018
FY2019E
FY2020E
160
140
Net sales
20,019
26,248
28,293
31,122
120
% chg
5.7
31.1
7.8
10.0
100
80
Adj. Net profit
1,491
1,571
1,808
1,884
60
% chg
92.7
5.4
15.0
4.2
40
20
EBITDA margin (%)
8.4
9.4
10.1
10.0
0
EPS (`)
5.1
5.4
6.2
6.4
P/E (x)
15.5
14.7
12.8
12.3
P/BV (x)
3.8
3.2
2.8
2.3
Source: Company, Angel Research
RoE (%)
24.3
22.0
21.5
19.1
RoCE (%)
14.0
23.5
24.5
23.0
Amarjeet S Maurya
EV/Sales (x)
1.1
0.7
0.7
0.6
022-40003600 Ext: 6831
EV/EBITDA (x)
12.8
7.0
6.5
5.7
Source: Company, Angel Research
Please refer to important disclosures at the end of this report
1
Ashok Leyland | 3QFY2019 Result Update
Exhibit 1: 3QFY2019 Performance
Y/E March (` cr)
3QFY19
3QFY18
% yoy
2QFY19
% qoq
9MFY19
9MFY18
% chg
Net Sales
6,325
7,191
(12.0)
7,621
(17.0)
20,209
17,576
15.0
Consumption of RM
4436
5,011
(11.5)
5498
(19.3)
14,250
12,183
17.0
(% of Sales)
70.1
69.7
72.1
70.5
69.3
Staff Costs
500
477
4.9
525
(4.8)
1525.3
1379.0
10.6
(% of Sales)
7.9
6.6
6.9
7.5
7.8
Other Expenses
747
1,135
(34.2)
789
(5.3)
2,331
2,460
(5.2)
(% of Sales)
11.8
15.8
10.3
11.5
14.0
Total Expenditure
5,683
6,622
(14.2)
6,811
(16.6)
18,107
16,022
13.0
Operating Profit
643
569
13.0
810
(20.6)
2,102
1,554
35.2
OPM
10.2
7.9
10.6
10.4
8.8
Interest
19
37
(47.9)
20
(6.1)
54
123
(56.2)
Depreciation
161
146
10.1
148
8.5
461.3
441.1
4.6
Other Income
21
307
(93.2)
30
(29.6)
103
390
(73.5)
PBT (excl. Ext Items)
484
693
(30.2)
671
(27.9)
1,690.30
1,380
22.5
Ext (Income)/Expense
-
-
-
-
-
PBT (incl. Ext Items)
484
693
(30.2)
671
(27.9)
1,690
1,380
22.5
(% of Sales)
7.6
9.6
8.8
8.4
7.9
Provision for Taxation
103
208
(50.6)
143
(28.2)
360
406
(11.2)
(% of PBT)
21.2
30.0
21.3
21.3
29.4
Reported PAT
381
485
(21.5)
528
(27.8)
1,330
975
36.5
PATM
6.0
6.7
6.9
6.6
5.5
Extra-ordinary Items
(5)
(2)
(15)
(34)
(14)
Adjusted Profit After Extra-ordinary item
386
487
(20.8)
543
(29.0)
1,364
988
38.0
Source: Company, Angel Research
February 19, 2019
2
Ashok Leyland | 3QFY2019 Result Update
Outlook and Valuation
We expect Ashok Leyland to register net profit (reported) CAGR of ~10% to
~`1,884cr over FY2018-20E mainly due to improvement in pre-buying sales
(owing to introduction of BSVI norms in FY2020) and replacement demand
(implementation of vehicle scrappage policy). Thus, we recommend BUY on the
stock with Target Price of `122.
Downside risks to our estimates
Slowdown in industrial activities could restrict sales volume for ALL.
Delay in implementation of vehicle scrappage policy could restrict the
additional sales growth for company.
Company Background
Ashok Leyland Ltd (ALL) is a holding company. The company is engaged in
commercial vehicles and related components. Through its subsidiaries, it is
engaged in manufacturing and trading in Medium and Heavy Commercial Vehicle
(MHCV), Light Commercial Vehicles (LCV), Passenger Vehicles (PV), automotive
aggregates, vehicle financing and engineering design services. It offers a range of
18 to 80 seater buses under categories such as city application and electric buses.
It offers a range of trucks, which includes long haul trucks, mining and construction
trucks, and distribution trucks. It designs, develops and manufactures defence
vehicles for armed forces. It offers Light Vehicles, which includes DOST, PARTNER,
STiLE and MiTR. It offers power solutions for electric power generation, agricultural
harvester combines, earth moving and construction equipment and marine and
other non-automotive applications. It has operations in India, Sri Lanka,
Bangladesh, Mauritius, the Middle East and Africa.
February 19, 2019
3
Ashok Leyland | 3QFY2019 Result Update
Standalone Profit & Loss Statement
Y/E March (` cr)
FY2016
FY2017
FY2018
FY2019E
FY2020E
Net Sales
18,937
20,019
26,248
28,293
31,122
% chg
39.6
5.7
31.1
7.8
10.0
Total Expenditure
17,498
18,341
23,774
25,435
28,010
Raw Material
13,195
13,973
18,621
20,229
22,252
Personnel
1,385
1,543
1,812
2,320
2,552
Others Expenses
2,918
2,825
3,341
2,886
3,206
EBITDA
1,439
1,677
2,474
2,858
3,112
% chg
79.4
16.5
47.5
15.5
8.9
(% of Net Sales)
7.6
8.4
9.4
10.1
10.0
Depreciation& Amortisation
488
518
555
624
680
EBIT
952
1,160
1,919
2,234
2,433
% chg
146.4
21.9
65.5
16.4
8.9
(% of Net Sales)
5.0
5.8
7.3
7.9
7.8
Interest & other Charges
248
155
131
73
61
Other Income
123
326
443
125
140
(% of PBT)
14.8
24.5
19.8
5.5
5.6
Recurring PBT
827
1,330
2,231
2,286
2,512
% chg
86.9
60.9
67.7
2.5
9.9
Tax
437
107
668
503
628
(% of PBT)
52.9
8.0
30.0
22.0
25.0
PAT (reported)
390
1,223
1,563
1,783
1,884
Extraordinary Items
(384)
(268)
(9)
(25)
-
ADJ. PAT
774
1,491
1,571
1,808
1,884
% chg
199.5
92.7
5.4
15.0
4.2
(% of Net Sales)
4.1
7.4
6.0
6.4
6.1
Basic EPS (`)
2.6
5.1
5.4
6.2
6.4
Fully Diluted EPS (`)
2.6
5.1
5.4
6.2
6.4
% chg
199.5
92.7
5.4
15.0
4.2
February 19, 2019
4
Ashok Leyland | 3QFY2019 Result Update
Standalone Balance Sheet
Y/E March (` cr)
FY2016
FY2017
FY2018
FY2019E FY2020E
SOURCES OF FUNDS
Equity Share Capital
285
285
293
293
293
Reserves& Surplus
5,123
5,841
6,861
8,107
9,590
Shareholders Funds
5,407
6,126
7,154
8,400
9,882
Total Loans
2,415
2,145
1,002
700
700
Deferred Tax Liability
753
741
726
726
726
Total Liabilities
8,575
9,012
8,882
9,826
11,308
APPLICATION OF FUNDS
Gross Block
5,279
5,858
6,312
6,958
7,658
Less: Acc. Depreciation
487
887
1,338
1,962
2,641
Net Block
4,792
4,971
4,974
4,996
5,017
Capital Work-in-Progress
76
206
401
401
401
Investments
1,980
2,879
5,803
2,774
2,774
Current Assets
5,925
5,744
5,408
9,332
11,591
Inventories
1,625
2,501
1,710
2,558
3,070
Sundry Debtors
1,251
860
980
1,705
2,046
Cash
1,593
912
1,004
2,381
3,207
Loans & Advances
712
709
1,120
1,415
1,712
Other Assets
745
762
593
1,273
1,556
Current liabilities
4,623
5,402
8,131
7,748
8,469
Net Current Assets
1,303
342
(2,723)
1,584
3,122
Deferred Tax Asset
424
614
427
427
427
Mis. Exp. not written off
-
-
-
-
-
Total Assets
8,575
9,012
8,882
9,826
11,308
February 19, 2019
5
Ashok Leyland | 3QFY2019 Result Update
Standalone Cashflow Statement
Y/E March (Rs cr)
FY2016
FY2017
FY2018
FY2019E FY2020E
Profit before tax
390
1223
1563
2286
2512
Depreciation
488
518
555
624
680
Change in Working Capital
(179)
190
2962
(2931)
(712)
Interest / Dividend (Net)
203
88
77
0
0
Direct taxes paid
(441)
(348)
(415)
(503)
(628)
Others
1223
484
677
0
0
Cash Flow from Operations
1683
2155
5418
(524)
1851
(Inc.)/ Dec. in Fixed Assets
34
(366)
(532)
(500)
(700)
(Inc.)/ Dec. in Investments
330
(1111)
(2800)
3028
0
Cash Flow from Investing
364
(1477)
(3332)
2528
(700)
Issue of Equity
0
0
0
0
0
Inc./(Dec.) in loans
(789)
(883)
(1270)
(302)
0
Dividend Paid (Incl. Tax)
(154)
(325)
(549)
(325)
(325)
Interest / Dividend (Net)
(263)
(151)
(175)
0
0
Cash Flow from Financing
(1205)
(1359)
(1994)
(628)
(325)
Inc./(Dec.) in Cash
842
(681)
92
1377
826
Opening Cash balances
751
1593
912
1004
2381
Closing Cash balances
1593
912
1004
2381
3207
February 19, 2019
6
Ashok Leyland | 3QFY2019 Result Update
Exhibit 2:
Y/E March
FY2016
FY2017
FY2018
FY2019E FY2020E
Valuation Ratio (x)
P/E (on FDEPS)
29.9
15.5
14.7
12.8
12.3
P/CEPS
26.4
13.3
10.9
9.6
9.0
P/BV
4.3
3.8
3.2
2.8
2.3
Dividend yield (%)
0.7
1.4
0.0
0.0
0.0
EV/Sales
1.2
1.1
0.7
0.7
0.6
EV/EBITDA
15.3
12.8
7.0
6.5
5.7
EV / Total Assets
2.6
2.4
1.9
1.8
1.5
Per Share Data (Rs)
EPS (Basic)
2.6
5.1
5.4
6.2
6.4
EPS (fully diluted)
2.6
5.1
5.4
6.2
6.4
Cash EPS
3.0
5.9
7.2
8.2
8.8
DPS
0.5
1.1
0.0
0.0
0.0
Book Value
18.5
20.9
24.4
28.7
33.8
Returns (%)
ROCE
12.2
14.0
23.5
24.5
23.0
Angel ROIC (Pre-tax)
22.4
25.9
142.2
56.6
52.9
ROE
14.3
24.3
22.0
21.5
19.1
Turnover ratios (x)
Asset Turnover (Gross Block)
3.6
3.4
4.2
4.1
4.1
Inventory / Sales (days)
31
46
24
33
36
Receivables (days)
24
16
14
22
24
Payables (days)
50
56
66
60
60
Working capital cycle (ex-cash) (days)
6
5
(29)
(5)
-
Source: Company, Angel Research
February 19, 2019
7
Ashok Leyland | 3QFY2019 Result Update
Research Team Tel: 022 - 39357800
DISCLAIMER
Angel Broking Limited (hereinafter referred to as “Angel”) is a registered Member of National Stock Exchange of India Limited, Bombay
Stock Exchange Limited and Metropolitan Stock Exchange Limited. It is also registered as a Depository Participant with CDSL and
Portfolio Manager and Investment Adviser with SEBI. It also has registration with AMFI as a Mutual Fund Distributor. Angel Broking
Limited is a registered entity with SEBI for Research Analyst in terms of SEBI (Research Analyst) Regulations, 2014 vide registration
number INH000000164. Angel or its associates has not been debarred/ suspended by SEBI or any other regulatory authority for
accessing /dealing in securities Market. Angel or its associates/analyst has not received any compensation / managed or co-managed
public offering of securities of the company covered by Analyst during the past twelve months.
This document is solely for the personal information of the recipient, and must not be singularly used as the basis of any investment
decision. Nothing in this document should be construed as investment or financial advice. Each recipient of this document should
make such investigations as they deem necessary to arrive at an independent evaluation of an investment in the securities of the
companies referred to in this document (including the merits and risks involved), and should consult their own advisors to determine
the merits and risks of such an investment.
Reports based on technical and derivative analysis center on studying charts of a stock's price movement, outstanding positions and
trading volume, as opposed to focusing on a company's fundamentals and, as such, may not match with a report on a company's
fundamentals. Investors are advised to refer the Fundamental and Technical Research Reports available on our website to evaluate the
contrary view, if any
The information in this document has been printed on the basis of publicly available information, internal data and other reliable
sources believed to be true, but we do not represent that it is accurate or complete and it should not be relied on as such, as this
document is for general guidance only. Angel Broking Limited or any of its affiliates/ group companies shall not be in any way
responsible for any loss or damage that may arise to any person from any inadvertent error in the information contained in this report.
Angel Broking Limited has not independently verified all the information contained within this document. Accordingly, we cannot testify,
nor make any representation or warranty, express or implied, to the accuracy, contents or data contained within this document. While
Angel Broking Limited endeavors to update on a reasonable basis the information discussed in this material, there may be regulatory,
compliance, or other reasons that prevent us from doing so.
This document is being supplied to you solely for your information, and its contents, information or data may not be reproduced,
redistributed or passed on, directly or indirectly.
Neither Angel Broking Limited, nor its directors, employees or affiliates shall be liable for any loss or damage that may arise from or in
connection with the use of this information.
Disclosure of Interest Statement
Ashok Leyland
1. Financial interest of research analyst or Angel or his Associate or his relative
No
2. Ownership of 1% or more of the stock by research analyst or Angel or associates or relatives
No
3. Served as an officer, director or employee of the company covered under Research
No
4. Broking relationship with company covered under Research
No
Ratings (Returns):
Buy (> 15%)
Accumulate (5% to 15%)
Neutral (-5 to 5%)
Reduce (-5% to -15%)
Sell (< -15%)
February 19, 2019
8